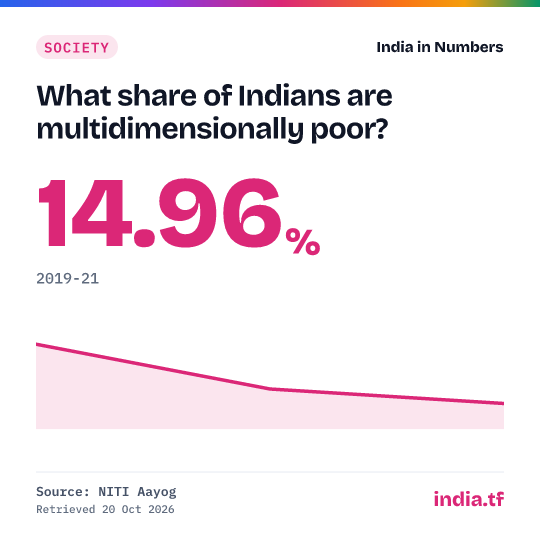
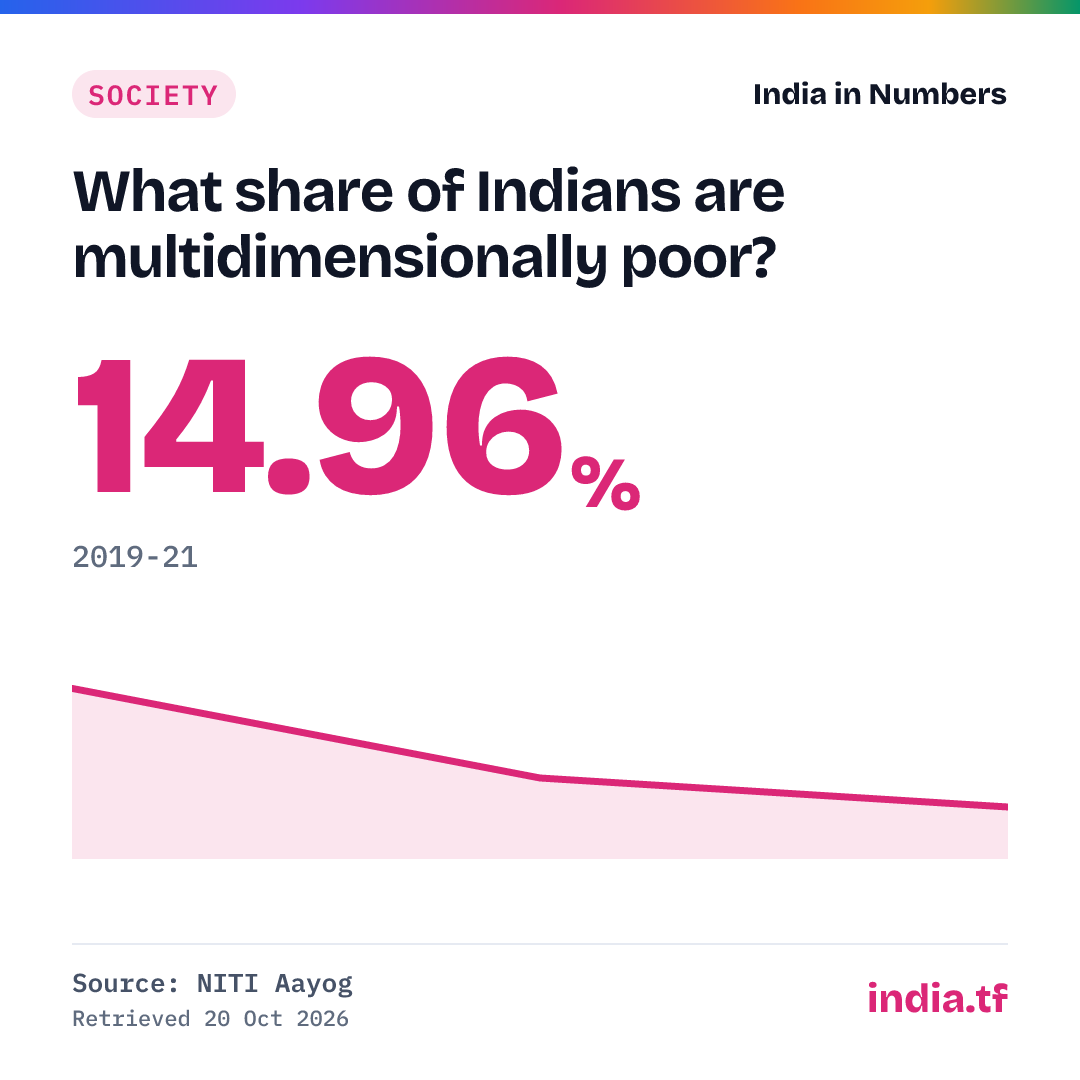
What share of Indians are multidimensionally poor?
NITI Aayog · released 17 Jul 2023
| Period | Value (%) |
|---|---|
| 2019-21 | 14.96 |
| 2015-16 | 24.85 |
| 2005-06 | 55.34 |
Use in your answer
14.96% of India's population was multidimensionally poor in 2019-21, down from 24.85% in 2015-16 (NITI Aayog, national Multidimensional Poverty Index). Source: NITI Aayog, Multidimensional Poverty in India since 2005-06 (Discussion Paper, January 2024); National Multidimensional Poverty Index: A Progress Review 2023.
Cite as: National Multidimensional Poverty Index: A Progress Review 2023; Multidimensional Poverty in India since 2005-06 (NITI Aayog), 2019-21
What this shows
- 14.96% of Indians were multidimensionally poor in 2019-21 (NFHS-5), down from 24.85% in 2015-16 (NFHS-4) and 55.34% in 2005-06 (NFHS-3); NITI Aayog estimates about 13.5 crore people left multidimensional poverty between 2015-16 and 2019-21.
- Rural poverty fell from 32.59% to 19.28% and urban from 8.65% to 5.27% between 2015-16 and 2019-21; Bihar, the poorest state, fell from 51.89% to 33.76%.
- NITI Aayog's January 2024 discussion paper projects 29.17% for 2013-14 and 11.28% for 2022-23 (about 24.82 crore people out of poverty in nine years). Both are projections from trend rates, not survey estimates.
The latest figure, as people 2019-21
Cite this
Cite a fixed version from every published version below.
Source and method
What exactly is measured
Share of the population that is multidimensionally poor under NITI Aayog's national Multidimensional Poverty Index: deprived in at least a third of 12 weighted indicators of health, education and living standards (nutrition, schooling, cooking fuel, sanitation, housing, bank account and others). Computed from the National Family Health Survey rounds, with indicators harmonised across rounds; the 2005-06 figure was estimated for NITI Aayog by the Oxford Poverty and Human Development Initiative. It is not an income or consumption poverty line.
History: every published version
Each time the source changes this series we archive the full series as it stood, with an archived copy of the source, and never delete an old version. Each version has a permanent page you can cite. Recorded since 20 Oct 2026: 1 version.
No figure in this series has been revised since we began recording on 20 Oct 2026.
- 3 periods, latest 2019-21: 14.96% · first snapshotArchived source
371cdf98519c
Release notes (2)
- 14.96%2019-21, National MPI Progress Review 2023
- 55.34%2005-06 estimate added, discussion paper
Get the data
Use it in Excel, Python or R
Excel (Data → From Web): https://india.tf/c/soc-mpi-084/data.csv
Python: pandas.read_csv("https://india.tf/c/soc-mpi-084/data.csv")
R: read.csv("https://india.tf/c/soc-mpi-084/data.csv")
All statistics: /api/index.json. Free to reuse with attribution (GODL-India).