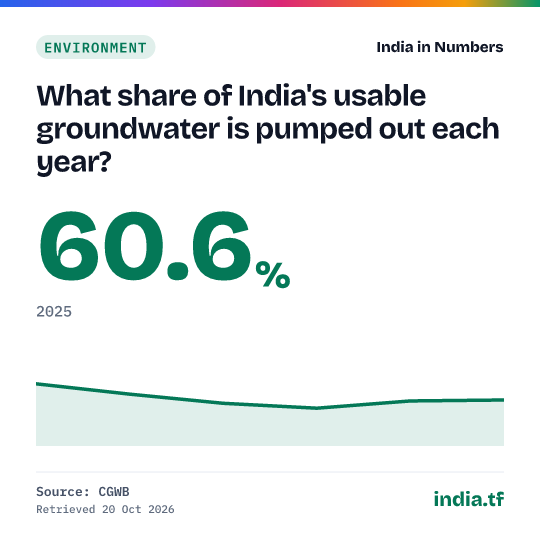
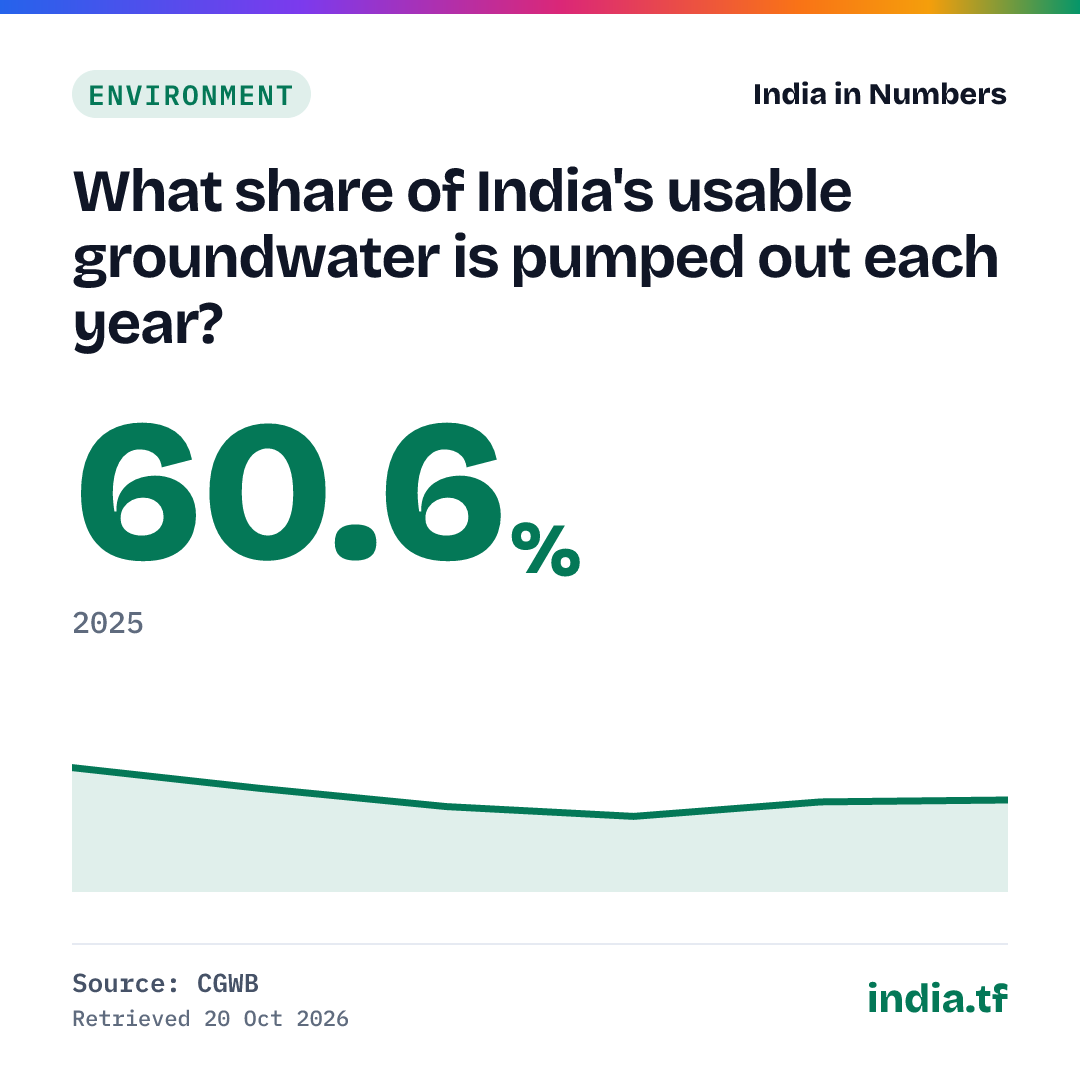
What share of India's usable groundwater is pumped out each year?
CGWB · released 18 Dec 2025 · next due by 16 Feb 2027
| Period | Value (%) |
|---|---|
| 2025 | 60.6 |
| 2024 | 60.5 |
| 2023 | 59.3 |
| 2022 | 60.1 |
| 2020 | 61.6 |
| 2017 | 63.3 |
Use in your answer
India's stage of groundwater extraction was 60.6% in the 2025 assessment, compared with 60.5% in 2024 (Central Ground Water Board). Source: Central Ground Water Board, National Compilation on Dynamic Ground Water Resources of India, 2025.
Cite as: Dynamic Ground Water Resource Assessment (National Compilation on Dynamic Ground Water Resources of India) (Central Ground Water Board), 2025
What this shows
- In 2025 India extracted 60.63% of its annual extractable groundwater (247.22 of 407.75 billion cubic metres), up slightly from 60.47% in 2024 and below the 70% mark above which an assessment unit stops being 'Safe'.
- Three states pump more than they can sustainably draw: Punjab (156.36%), Rajasthan (147.11%) and Haryana (136.75%); Delhi stood at 92.10% in 2025.
- 730 of 6,762 assessment units (10.80%) were over-exploited in 2025, down from 1,186 (17.2%) in 2017; agriculture accounts for 87% of all groundwater extraction.
Cite this
Cite a fixed version from every published version below.
Source and method
What exactly is measured
Stage of groundwater extraction: annual groundwater extraction for irrigation, domestic and industrial use as a share of the annual extractable groundwater resource, from the Central Ground Water Board's Dynamic Ground Water Resource Assessment. Only assessments under the GEC-2015 methodology (2017 onwards) are shown; the 2004–2013 assessments used GEC-1997 and are not comparable. Assessments have been annual since 2022.
Groundwater extraction by state
Stage of groundwater extraction: annual extraction for all uses as a share of the annual extractable groundwater resource. Above 100% a state draws more than is replenished. Dadra & Nagar Haveli and Daman & Diu fell from 142.17% to 40.45% in 2025 after its extraction estimate was cut from 0.16 to 0.05 bcm. Source: Central Ground Water Board, National Compilation on Dynamic Ground Water Resources of India, 2025, 2025.
Where
Ranked
How are the states spread?
22 of 36 states fall between 0% and 50%. Each column counts the states in one band of groundwater extraction; the dashed line is the all-India figure.
Hover a column for the states in it. Bands are equal widths of the state figures, 2025.
History: every published version
Each time the source changes this series we archive the full series as it stood, with an archived copy of the source, and never delete an old version. Each version has a permanent page you can cite. Recorded since 20 Oct 2026: 1 version.
No figure in this series has been revised since we began recording on 20 Oct 2026.
- 6 periods, latest 2025: 60.6% · first snapshotArchived source
9b4b5f18c69e
Release notes (1)
- 60.63%2025 assessment, National Compilation
Get the data
Use it in Excel, Python or R
Excel (Data → From Web): https://india.tf/c/soc-groundwater-096/data.csv
Python: pandas.read_csv("https://india.tf/c/soc-groundwater-096/data.csv")
R: read.csv("https://india.tf/c/soc-groundwater-096/data.csv")
All statistics: /api/index.json. Free to reuse with attribution (GODL-India).