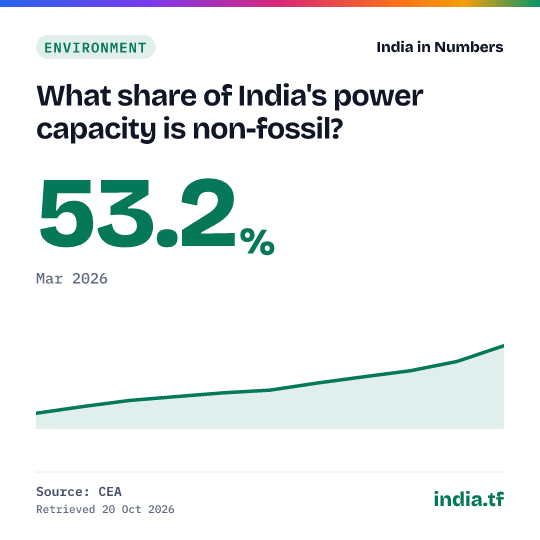
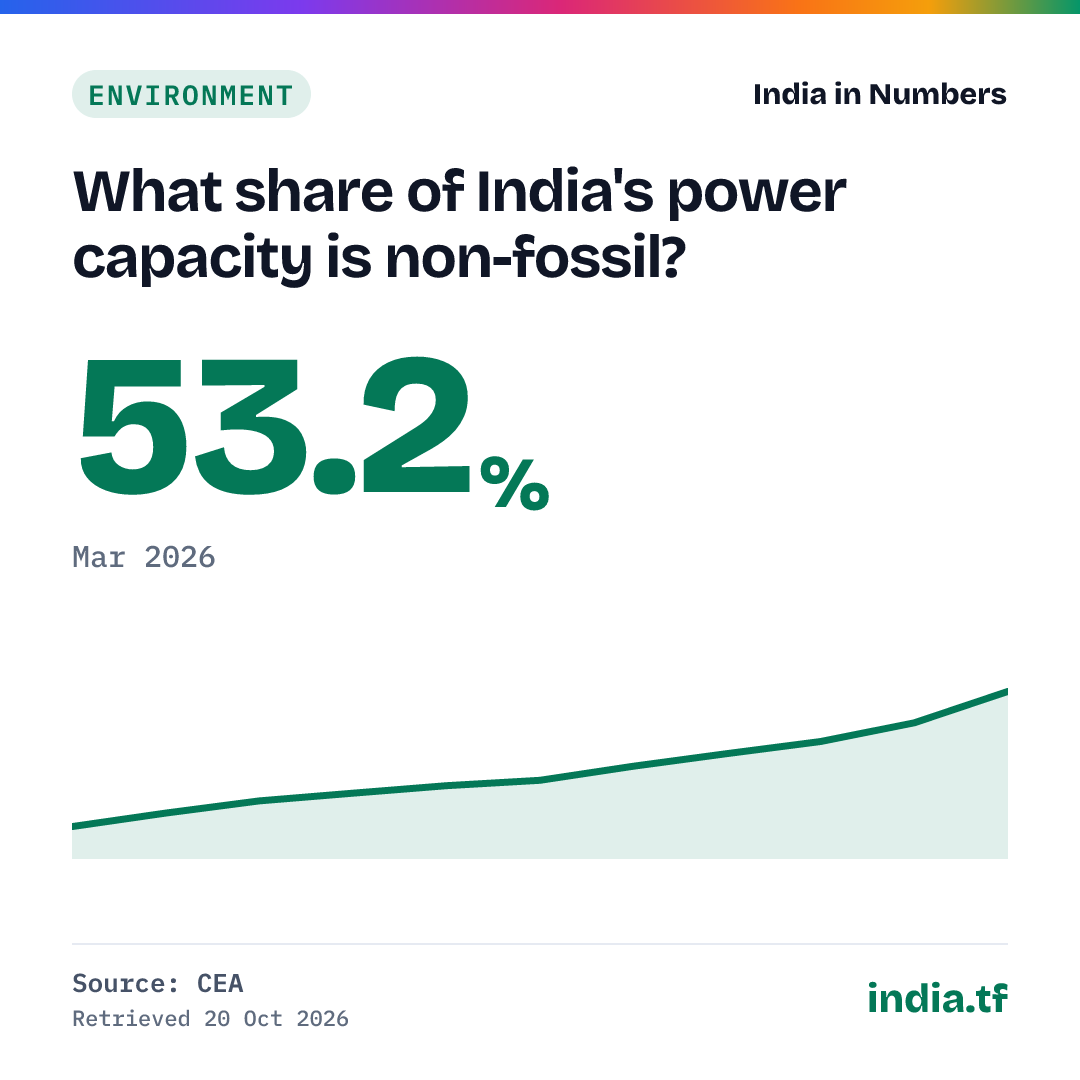
What share of India's power capacity is non-fossil?
CEA · released 13 Apr 2026 · next due by 12 Jun 2027
| Period | Value (%) |
|---|---|
| Mar 2026 | 53.2 |
| Mar 2025 | 48.0 |
| Mar 2024 | 45.0 |
| Mar 2023 | 43.0 |
| Mar 2022 | 40.9 |
| Mar 2021 | 38.6 |
| Mar 2020 | 37.7 |
| Mar 2019 | 36.5 |
| Mar 2018 | 35.2 |
| Mar 2017 | 33.2 |
| Mar 2016 | 31.0 |
Use in your answer
Non-fossil sources made up 53.2% of India's installed power capacity at the end of Mar 2026 (CEA), up from 48.0% in Mar 2025. Source: Central Electricity Authority, Installed Capacity reports (end of March each year).
Cite as: Installed Capacity report (monthly) (Central Electricity Authority), Mar 2026
What this shows
- Non-fossil sources made up 53.2% of India's installed power capacity at the end of March 2026 (283.5 of 532.7 GW), up from 31.0% in March 2016. By 30 September 2026 the share was 55.1% (308.0 of 558.9 GW).
- India passed the updated NDC goal of about 50% non-fossil capacity by 2030 in June 2025 (50.1% on 30 June 2025). The 2015 NDC goal of 40% was passed by March 2022 (40.9%).
- Solar alone was 171.1 GW, 30.6% of capacity, in September 2026, against 225.1 GW (40.3%) of coal. Capacity is not generation: thermal plants still produced 1,307 of 1,848 billion units in 2025-26.
Cite this
Cite a fixed version from every published version below.
Source and method
What exactly is measured
Non-fossil sources (nuclear, large hydro including pumped storage, and renewables: solar, wind, small hydro, bio-power and waste-to-energy) as a share of India's total installed electricity generating capacity, at the end of each financial year, from the Central Electricity Authority's monthly installed capacity reports. It measures capacity, not the electricity actually generated, most of which still comes from coal.
History: every published version
Each time the source changes this series we archive the full series as it stood, with an archived copy of the source, and never delete an old version. Each version has a permanent page you can cite. Recorded since 20 Oct 2026: 1 version.
No figure in this series has been revised since we began recording on 20 Oct 2026.
Release notes (1)
- 53.2%End-March 2026, CEA installed capacity report
Get the data
Use it in Excel, Python or R
Excel (Data → From Web): https://india.tf/c/env-nonfossil-106/data.csv
Python: pandas.read_csv("https://india.tf/c/env-nonfossil-106/data.csv")
R: read.csv("https://india.tf/c/env-nonfossil-106/data.csv")
All statistics: /api/index.json. Free to reuse with attribution (GODL-India).