How much renewable power capacity has India installed?
MNRE · released 11 Aug 2026 · next due by 15 Sep 2026
| Period | Value (GW) |
|---|---|
| Jul 2026 | 291.7 |
| Jun 2026 | 288.6 |
| May 2026 | 282.7 |
| Apr 2026 | 279.3 |
| Mar 2026 | 274.7 |
| Feb 2026 | 266.7 |
| Jan 2026 | 263.2 |
| Dec 2025 | 258.0 |
| Nov 2025 | 254.0 |
| Oct 2025 | 250.6 |
| Sep 2025 | 247.3 |
| Aug 2025 | 242.6 |
| Jul 2025 | 237.5 |
| Jun 2025 | 234.0 |
| May 2025 | 226.8 |
| Apr 2025 | 223.6 |
| Mar 2025 | 220.1 |
| Feb 2025 | 214.7 |
| Jan 2025 | 212.2 |
| Dec 2024 | 209.4 |
| Nov 2024 | 205.5 |
| Oct 2024 | 203.2 |
| Sep 2024 | 201.5 |
| Aug 2024 | 199.6 |
| Jul 2024 | 197.2 |
| Jun 2024 | 195.0 |
| May 2024 | 193.6 |
| Apr 2024 | 191.7 |
| Mar 2024 | 190.6 |
| Feb 2024 | 183.5 |
Use in your answer
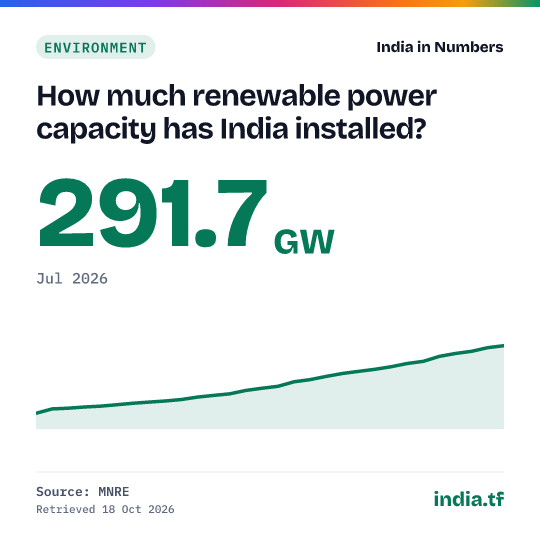
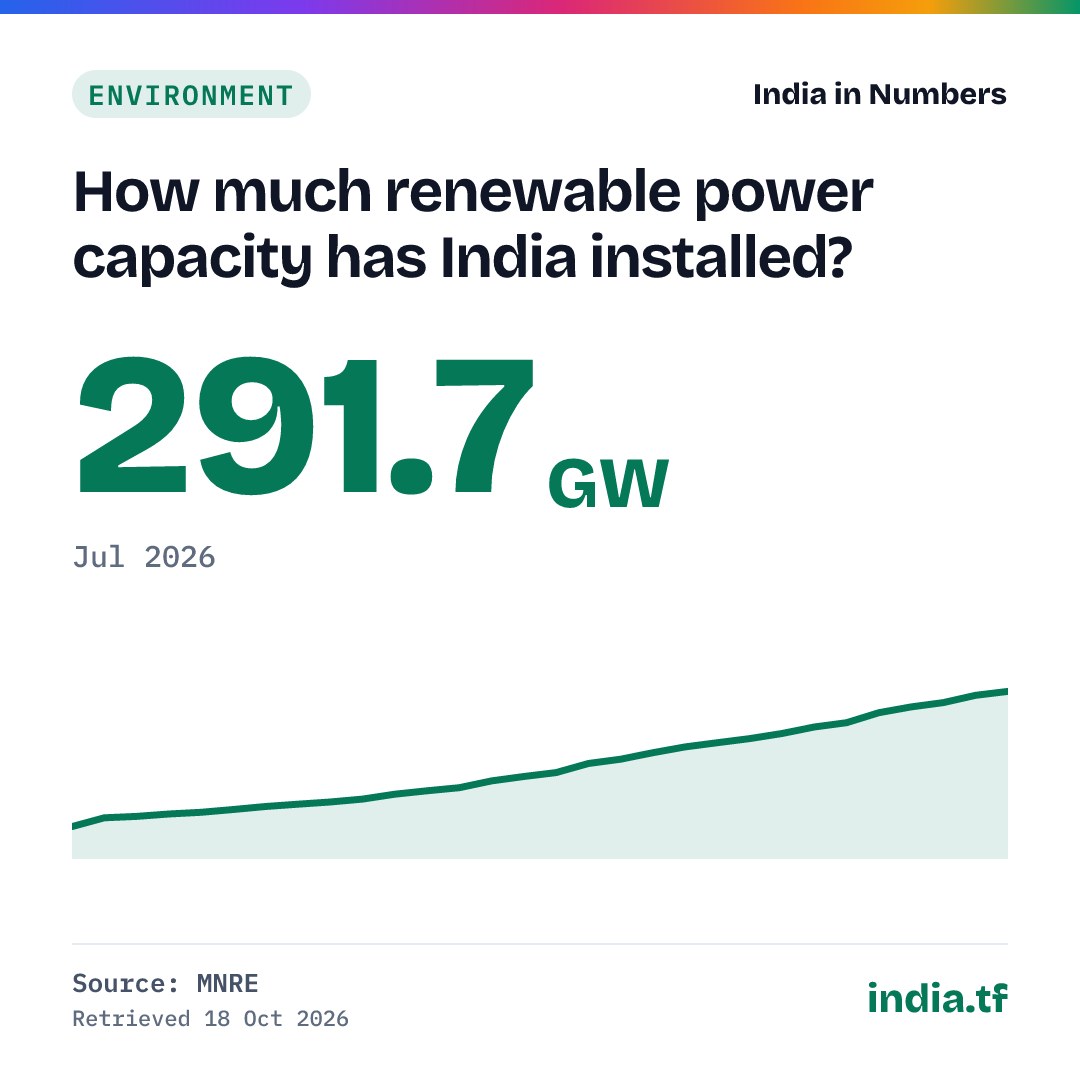
India's installed renewable power capacity, including large hydro, was 291.7 GW at the end of Jul 2026 (MNRE), up from 288.6 GW in Jun 2026. Source: Ministry of New and Renewable Energy, Physical Progress (installed RE capacity), served by MoSPI's data server.
Cite as: Physical Progress: installed renewable energy capacity (state-wise RE installed capacity) (MNRE), Jul 2026
What this shows
- India had 291.7 GW of renewable capacity at the end of July 2026, counting large hydro (52.1 GW, which includes 7.4 GW of pumped storage). Without large hydro it was 239.7 GW.
- Solar made up more than half: 164.6 GW, against 58.1 GW of wind, 11.7 GW of bio-power and 5.2 GW of small hydro.
- 17.0 GW was added between April and July 2026, 14.3 GW of it solar. With 8.8 GW of nuclear, India's non-fossil capacity was 300.5 GW.
Cite this
Cite a fixed version from every published version below.
Source and method
What exactly is measured
Installed renewable power capacity at the end of each month, in gigawatts, as the Ministry of New and Renewable Energy (MNRE) reports it: solar, wind, small hydro, bio-power and large hydro (including pumped storage). MNRE added large hydro to its renewable total from its January 2024 report; the series starts in February 2024, the first month the MoSPI copy matches MNRE's published total. It measures capacity, not the electricity generated.
Renewable power capacity by state
Installed renewable power capacity (solar, wind, small hydro, bio-power and large hydro) located in each state, in gigawatts, at the end of the month. The all-India total also includes 0.05 GW MNRE lists under 'Others', which no state row carries. Source: Ministry of New and Renewable Energy, State-wise (location based) installed capacity of renewable power, served by MoSPI's data server, Jul 2026.
Where
Ranked
How are the states spread?
28 of 36 states fall between 0 GW and 10 GW. Each column counts the states in one band of renewable power capacity.
Hover a column for the states in it. Bands are equal widths of the state figures, Jul 2026.
History: every published version
Each time the source changes this series we archive the full series as it stood, with an archived copy of the source, and never delete an old version. Each version has a permanent page you can cite. Recorded since 18 Oct 2026: 1 version.
No figure in this series has been revised since we began recording on 18 Oct 2026.
- 30 periods, latest Jul 2026: 291.7 GW · first snapshotArchived source
3d52f137b64d
Release notes (1)
- 291.7 GWJul 2026
Get the data
Use it in Excel, Python or R
Excel (Data → From Web): https://india.tf/c/env-renew-066/data.csv
Python: pandas.read_csv("https://india.tf/c/env-renew-066/data.csv")
R: read.csv("https://india.tf/c/env-renew-066/data.csv")
All statistics: /api/index.json. Free to reuse with attribution (GODL-India).