How much solar power capacity has India installed?
MNRE · released 11 Aug 2026 · next due by 15 Sep 2026
| Period | Value (GW) |
|---|---|
| Jul 2026 | 164.6 |
| Jun 2026 | 162.2 |
| May 2026 | 157.0 |
| Apr 2026 | 154.2 |
| Mar 2026 | 150.3 |
| Feb 2026 | 143.6 |
| Jan 2026 | 140.6 |
| Dec 2025 | 135.8 |
| Nov 2025 | 132.8 |
| Oct 2025 | 129.9 |
| Sep 2025 | 127.3 |
| Aug 2025 | 123.1 |
| Jul 2025 | 119.0 |
| Jun 2025 | 116.2 |
| May 2025 | 110.8 |
| Apr 2025 | 107.9 |
| Mar 2025 | 105.6 |
| Feb 2025 | 102.6 |
| Jan 2025 | 100.3 |
| Dec 2024 | 97.9 |
| Nov 2024 | 94.2 |
| Oct 2024 | 92.1 |
| Sep 2024 | 90.8 |
| Aug 2024 | 89.4 |
| Jul 2024 | 87.2 |
| Jun 2024 | 85.5 |
| May 2024 | 84.3 |
| Apr 2024 | 82.6 |
| Mar 2024 | 81.8 |
| Feb 2024 | 75.6 |
| Jan 2024 | 74.3 |
Use in your answer
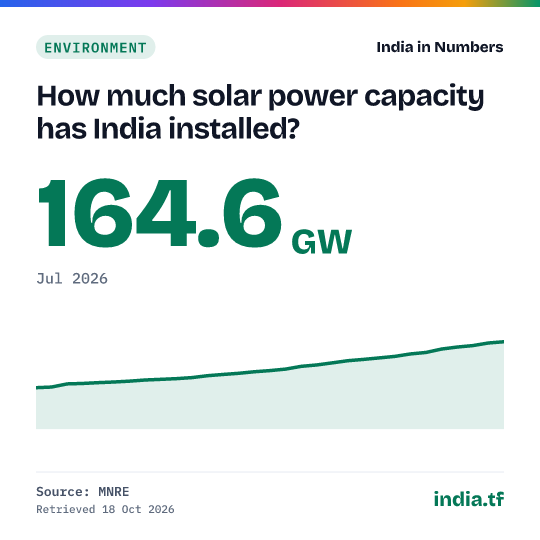
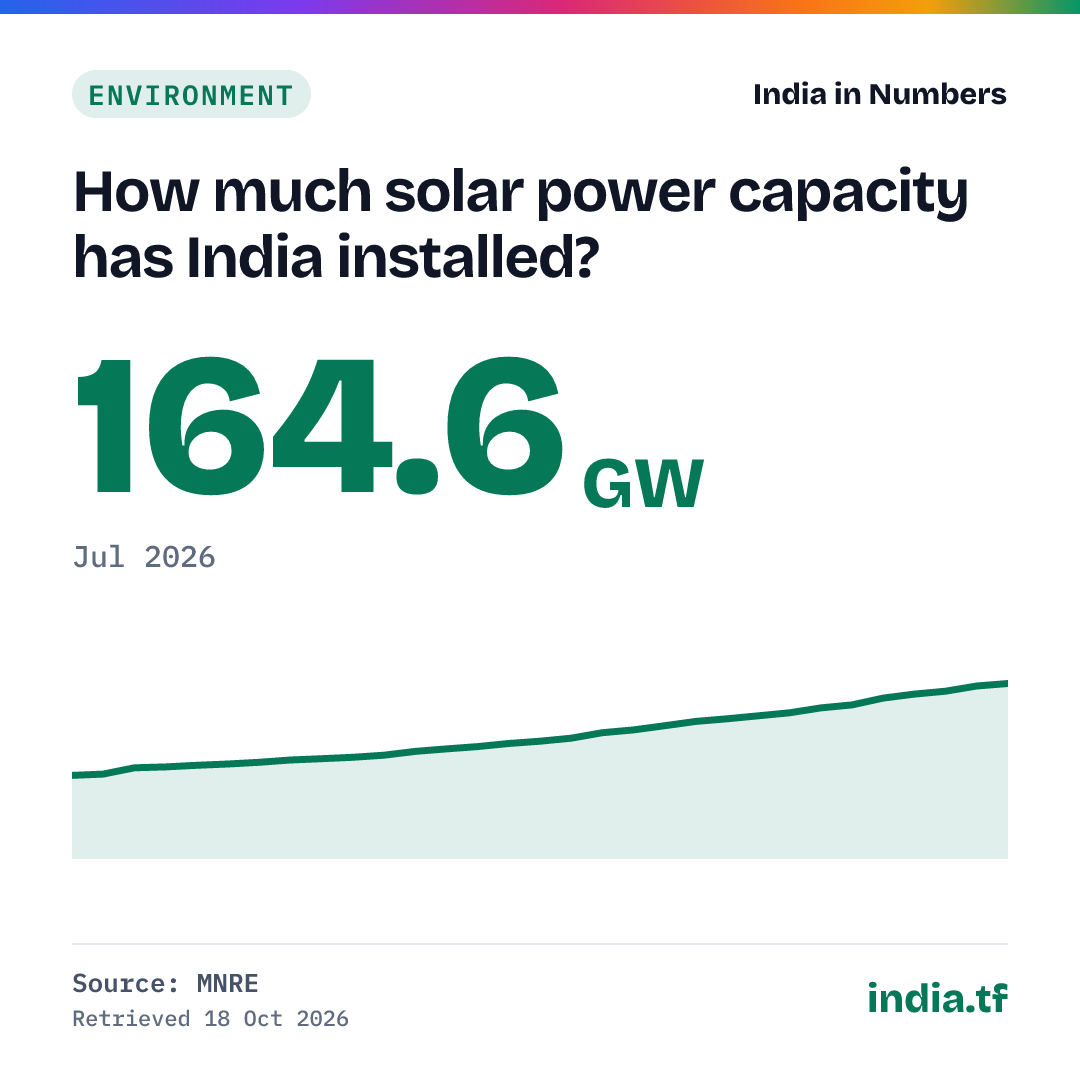
India's installed solar power capacity was 164.6 GW at the end of Jul 2026 (MNRE), up from 162.2 GW in Jun 2026. Source: Ministry of New and Renewable Energy, Physical Progress (installed RE capacity), served by MoSPI's data server.
Cite as: Physical Progress: installed renewable energy capacity (state-wise RE installed capacity) (MNRE), Jul 2026
What this shows
- India had 164.6 GW of solar capacity at the end of July 2026, more than double the 74.3 GW of January 2024.
- Ground-mounted plants were 122.6 GW of it, rooftop solar 30.7 GW, the solar part of hybrid projects 4.8 GW and off-grid solar and PM-KUSUM 6.5 GW.
- 44.6 GW of solar was added in 2025-26, and 14.3 GW more between April and July 2026.
Cite this
Cite a fixed version from every published version below.
Source and method
What exactly is measured
Installed solar power capacity at the end of each month, in gigawatts, as MNRE reports it: ground-mounted plants, rooftop solar (including PM Surya Ghar), the solar part of hybrid projects, and off-grid solar and PM-KUSUM. It measures capacity, not the electricity generated.
History: every published version
Each time the source changes this series we archive the full series as it stood, with an archived copy of the source, and never delete an old version. Each version has a permanent page you can cite. Recorded since 18 Oct 2026: 1 version.
No figure in this series has been revised since we began recording on 18 Oct 2026.
- 31 periods, latest Jul 2026: 164.6 GW · first snapshotArchived source
a44f05ec4a7f
Release notes (1)
- 164.6 GWJul 2026
Get the data
Use it in Excel, Python or R
Excel (Data → From Web): https://india.tf/c/env-solar-067/data.csv
Python: pandas.read_csv("https://india.tf/c/env-solar-067/data.csv")
R: read.csv("https://india.tf/c/env-solar-067/data.csv")
All statistics: /api/index.json. Free to reuse with attribution (GODL-India).