How much foreign direct investment equity does India attract?
DPIIT · released 14 Sep 2026 · next due by 8 Jan 2027
| Period | Value (US$ bn) |
|---|---|
| 2025-26 | 58.8 |
| 2024-25 | 50.0 |
| 2023-24 | 44.4 |
| 2022-23 | 46.0 |
| 2021-22 | 58.8 |
| 2020-21 | 59.6 |
| 2019-20 | 50.0 |
| 2018-19 | 44.4 |
| 2017-18 | 44.9 |
| 2016-17 | 43.5 |
| 2015-16 | 40.0 |
| 2014-15 | 29.7 |
| 2013-14 | 24.3 |
| 2012-13 | 22.4 |
Use in your answer
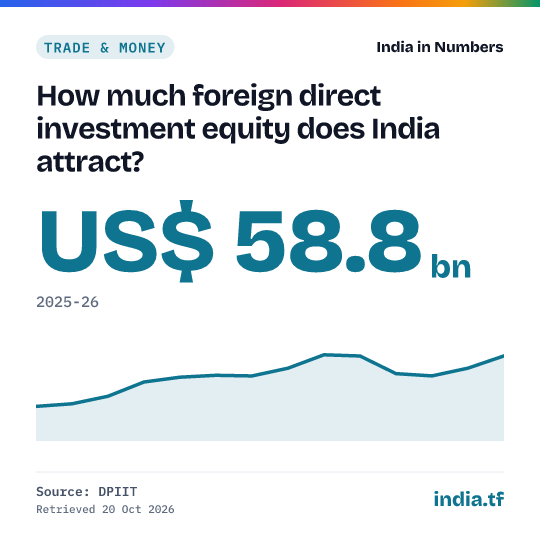
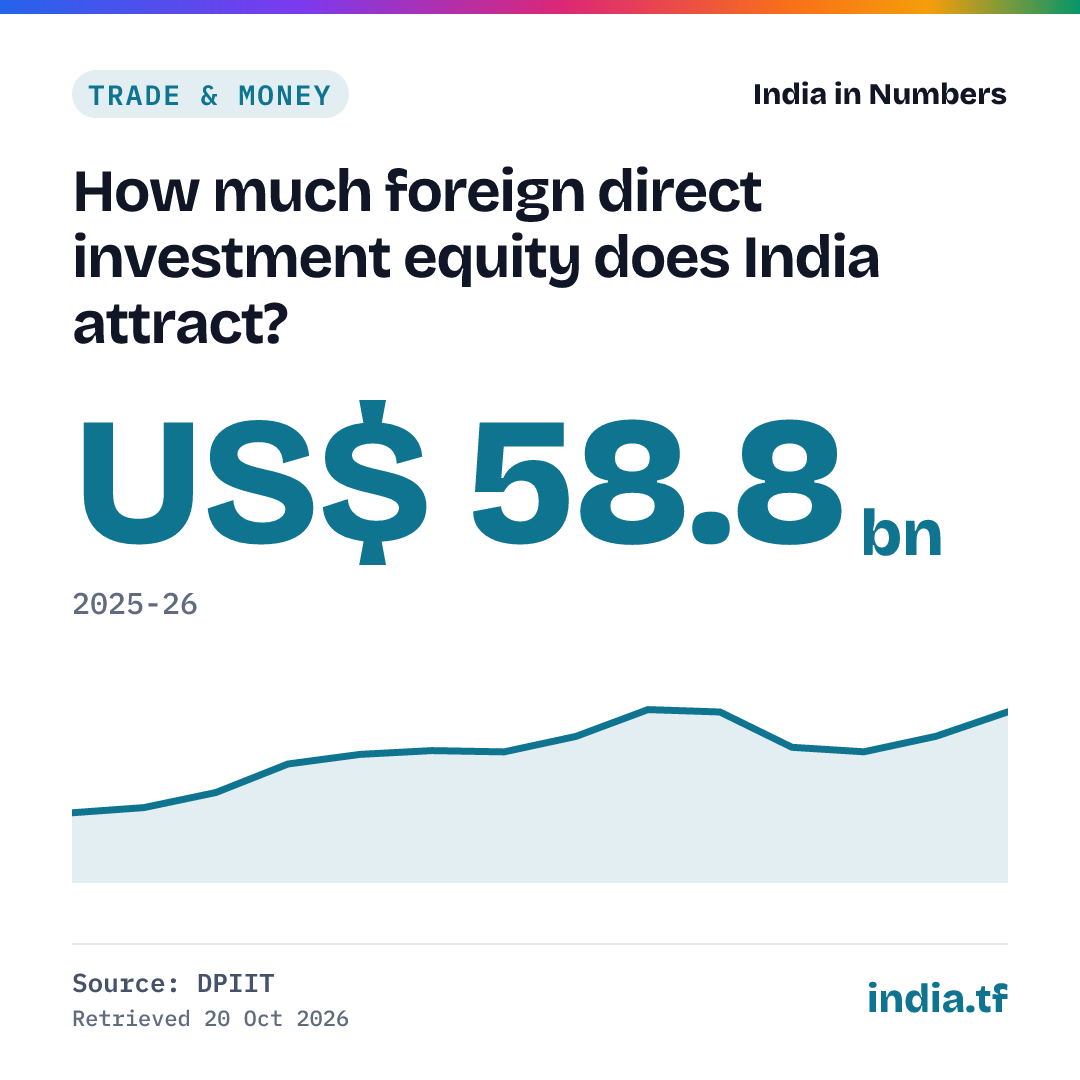
India received FDI equity inflows of US$ 58.8 bn in 2025-26, compared with US$ 50.0 bn in 2024-25, according to DPIIT. Source: DPIIT, Quarterly Fact Sheet on Foreign Direct Investment (April 2000 to June 2026).
Cite as: Fact Sheet on Foreign Direct Investment (quarterly) (DPIIT), 2025-26
What this shows
- FDI equity inflows were US$ 58.8 billion (₹5,16,936 crore) in 2025-26, 18% more than the US$ 50.0 billion of 2024-25 and just below the US$ 59.6 billion of 2020-21, the highest year in this series.
- In 2025-26 Singapore (US$ 19.8 billion) and the USA (US$ 11.2 billion) were the largest sources, computer software & hardware (US$ 13.9 billion) and services (US$ 10.0 billion) the largest sectors, and Maharashtra (US$ 18.4 billion) and Karnataka (US$ 12.9 billion) the largest recipient states.
- Equity is not total FDI: with reinvested earnings and other capital, gross FDI inflows were US$ 94.8 billion in 2025-26. April–June 2026 equity inflows were US$ 19.8 billion, 6% more than a year earlier (provisional).
Cite this
Cite a fixed version from every published version below.
Source and method
What exactly is measured
Foreign direct investment equity inflows into India each financial year, in US$ billion, from DPIIT's FDI database (government route, automatic route and acquisition of existing shares). This is equity only: total FDI, which adds reinvested earnings and other capital, is a separate and larger series. The latest year is provisional, subject to reconciliation with the RBI. Years before 2012-13 carry footnotes (NRI-scheme money, 2011-12 adjustments) and are left out.
History: every published version
Each time the source changes this series we archive the full series as it stood, with an archived copy of the source, and never delete an old version. Each version has a permanent page you can cite. Recorded since 20 Oct 2026: 1 version.
No figure in this series has been revised since we began recording on 20 Oct 2026.
- 14 periods, latest 2025-26: US$ 58.8 bn · first snapshotArchived source
a61d8e40f08f
Release notes (2)
- US$ 58.8 bn2025-26, first full-year figure (fact sheet up to March 2026)
- US$ 58.8 bn2025-26, fact sheet up to June 2026 (unchanged)
Get the data
Use it in Excel, Python or R
Excel (Data → From Web): https://india.tf/c/trd-fdi-075/data.csv
Python: pandas.read_csv("https://india.tf/c/trd-fdi-075/data.csv")
R: read.csv("https://india.tf/c/trd-fdi-075/data.csv")
All statistics: /api/index.json. Free to reuse with attribution (GODL-India).