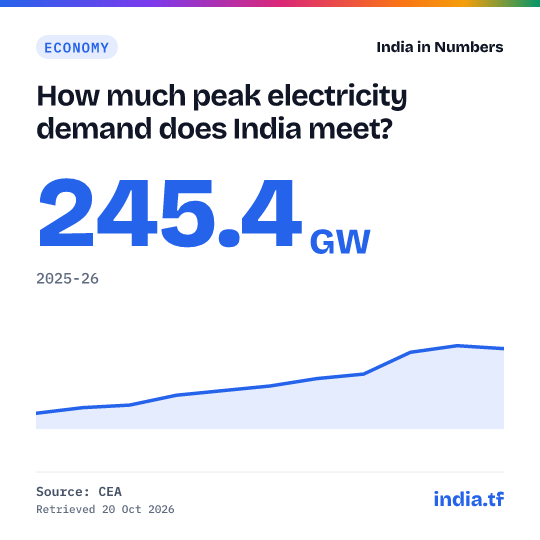
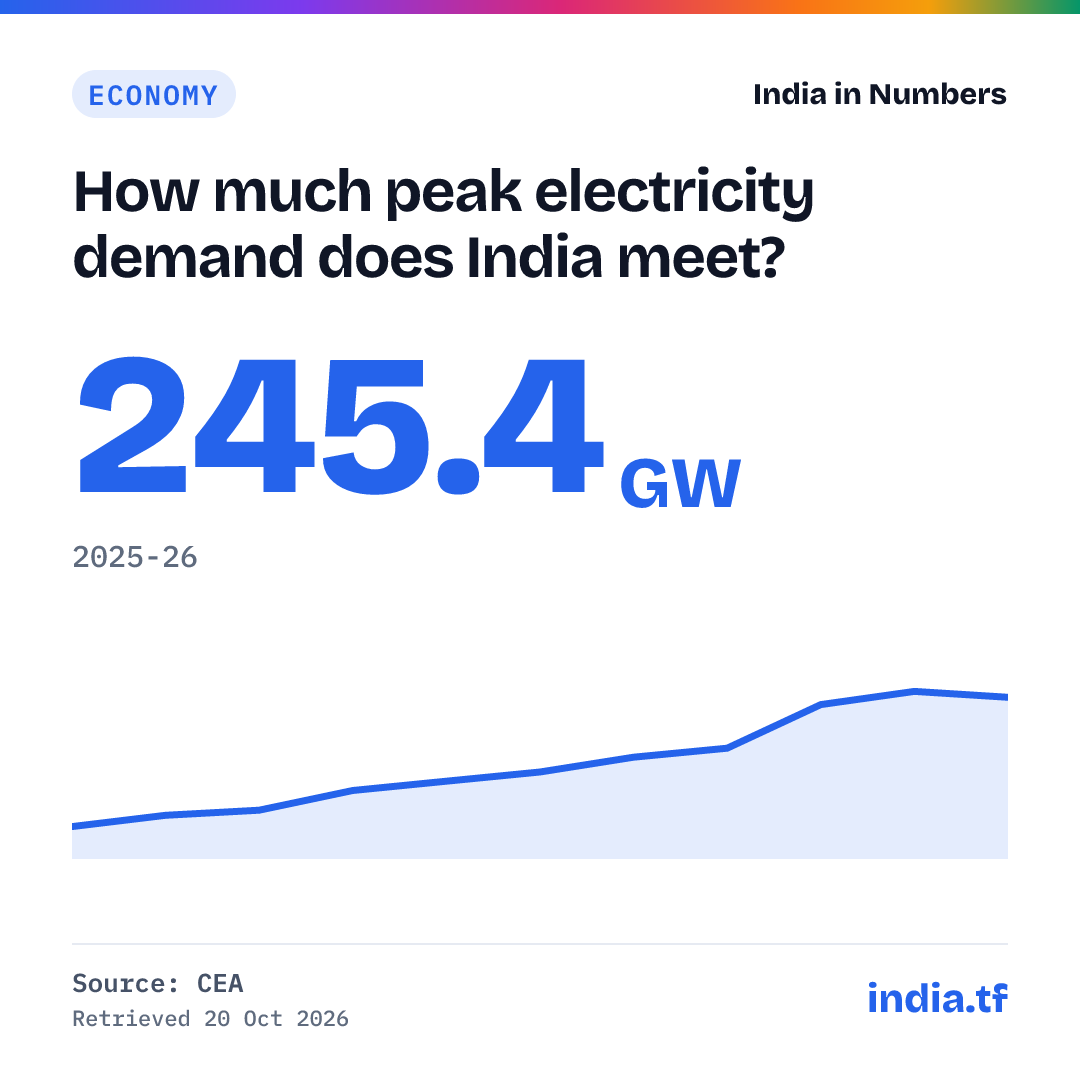
How much peak electricity demand does India meet?
CEA · released 24 Jun 2026
| Period | Value (GW) |
|---|---|
| 2025-26 | 245.4 |
| 2024-25 | 249.9 |
| 2023-24 | 239.9 |
| 2022-23 | 207.2 |
| 2021-22 | 200.5 |
| 2020-21 | 189.4 |
| 2019-20 | 182.5 |
| 2018-19 | 175.5 |
| 2017-18 | 160.8 |
| 2016-17 | 156.9 |
| 2015-16 | 148.5 |
Use in your answer
India's peak electricity demand met was 245.4 GW in 2025-26 (CEA), compared with 249.9 GW in 2024-25. Source: Central Electricity Authority, Executive Summary on Power Sector, August 2026.
Cite as: Executive Summary on Power Sector (power supply position) (Central Electricity Authority), 2025-26
What this shows
- India met a peak demand of 245.4 GW in 2025-26, down from 249.9 GW in 2024-25, the first fall in the decade shown; it was 148.5 GW in 2015-16.
- The biggest jump came in 2023-24, when peak demand met rose 15.8% to 239.9 GW. Peak shortages have all but gone: 28 MW in 2025-26 against 4.9 GW (3.2%) in 2015-16.
- In 2026-27 so far (April to July 2026) the grid has already met 270.8 GW, well above the 2025-26 peak, with a shortfall of only 12 MW.
Cite this
Cite a fixed version from every published version below.
Source and method
What exactly is measured
The highest all-India electricity demand actually met in a financial year, in gigawatts, from the Central Electricity Authority's power supply position. Peak demand met is the most power the grid supplied at one time; any shortfall against peak demand is shown separately.
History: every published version
Each time the source changes this series we archive the full series as it stood, with an archived copy of the source, and never delete an old version. Each version has a permanent page you can cite. Recorded since 20 Oct 2026: 1 version.
No figure in this series has been revised since we began recording on 20 Oct 2026.
- 11 periods, latest 2025-26: 245.4 GW · first snapshotArchived source
83c58882d267
Release notes (1)
- 245.4 GW (2,45,416 MW)2025-26 full year, CEA Executive Summary May 2026
Get the data
Use it in Excel, Python or R
Excel (Data → From Web): https://india.tf/c/eco-peakpower-107/data.csv
Python: pandas.read_csv("https://india.tf/c/eco-peakpower-107/data.csv")
R: read.csv("https://india.tf/c/eco-peakpower-107/data.csv")
All statistics: /api/index.json. Free to reuse with attribution (GODL-India).