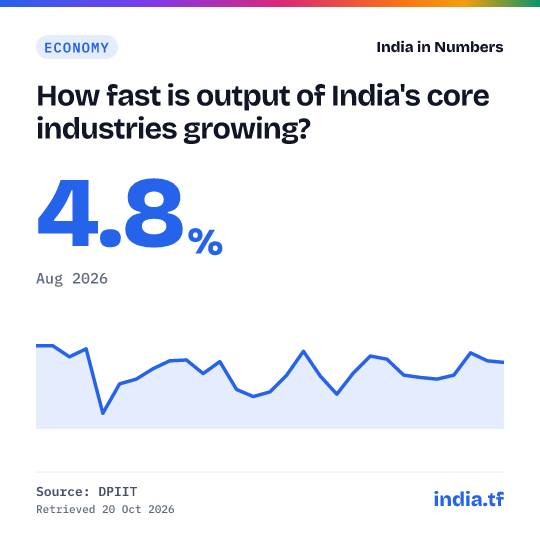
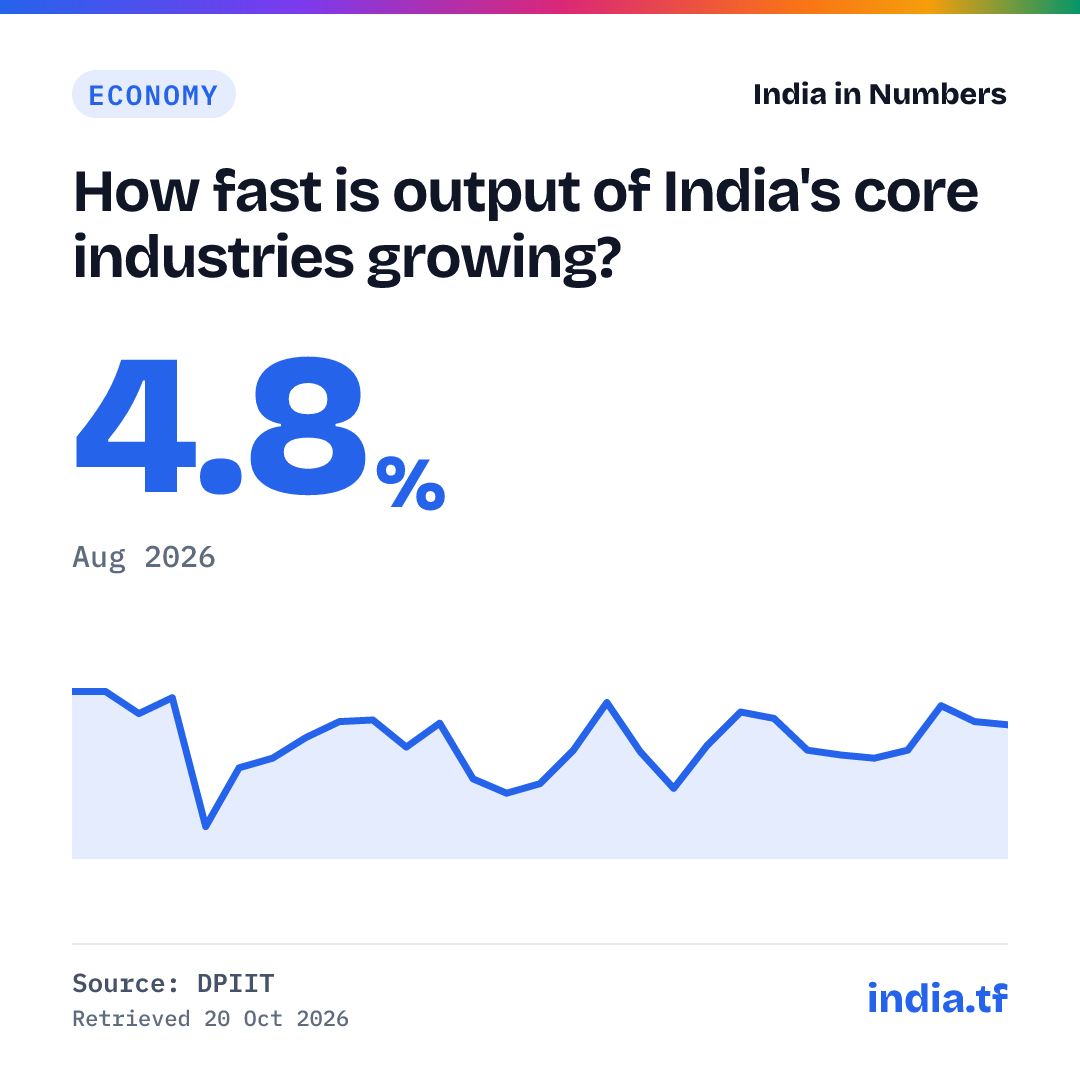
How fast is output of India's core industries growing?
DPIIT · released 21 Sep 2026 · next due by 21 Oct 2026
| Period | Value (%) |
|---|---|
| Aug 2026 | 4.8 |
| Jul 2026 | 5.0 |
| Jun 2026 | 6.0 |
| May 2026 | 3.2 |
| Apr 2026 | 2.7 |
| Mar 2026 | 2.9 |
| Feb 2026 | 3.2 |
| Jan 2026 | 5.2 |
| Dec 2025 | 5.6 |
| Nov 2025 | 3.5 |
| Oct 2025 | 0.8 |
| Sep 2025 | 3.1 |
| Aug 2025 | 6.2 |
| Jul 2025 | 3.2 |
| Jun 2025 | 1.1 |
| May 2025 | 0.5 |
| Apr 2025 | 1.4 |
| Mar 2025 | 4.9 |
| Feb 2025 | 3.4 |
| Jan 2025 | 5.1 |
| Dec 2024 | 5.0 |
| Nov 2024 | 4.0 |
| Oct 2024 | 2.7 |
| Sep 2024 | 2.1 |
| Aug 2024 | −1.6 |
| Jul 2024 | 6.5 |
| Jun 2024 | 5.5 |
| May 2024 | 6.9 |
| Apr 2024 | 6.9 |
Use in your answer
Output of India's nine core industries (Index of Core Industries, base 2022-23) grew 4.8% year on year in Aug 2026, compared with 5.0% in Jul 2026. Source: Office of the Economic Adviser, DPIIT, Index of Core Industries (base 2022-23=100).
Cite as: Index of Core Industries (ICI) (Office of the Economic Adviser, DPIIT), Aug 2026
What this shows
- Core industries' output grew 4.8% in August 2026 (provisional), after 5.0% in July; cement (12.5%), electricity (11.6%), iron ore (5.5%), steel (3.4%) and refinery products (2.6%) grew, while coal, natural gas, crude oil and fertilisers shrank.
- Growth was 4.3% over April–August 2026, against 2.4% a year earlier; for full years it was 4.3% in 2024-25 and 3.0% in 2025-26 (base 2022-23).
- Electricity has the largest weight (30.9%), then refinery products (22.6%) and steel (17.6%); together the nine industries make up 32.88% of the weight of items in the IIP (2022-23). Provisional figures move: July 2026 was first put at 5.4% and revised to 5.0%.
Cite this
Cite a fixed version from every published version below.
Source and method
What exactly is measured
Year-on-year growth in the Index of Core Industries (base 2022-23=100), which tracks the output of nine industries: coal, natural gas, crude oil, refinery products, fertilisers, steel, cement, electricity and iron ore. Compiled by the Office of the Economic Adviser, DPIIT. Growth on the new base starts in April 2024; the old 2011-12 series (eight industries, no iron ore) is not comparable and is not shown. The latest month is provisional and is revised a month later.
History: every published version
Each time the source changes this series we archive the full series as it stood, with an archived copy of the source, and never delete an old version. Each version has a permanent page you can cite. Recorded since 20 Oct 2026: 1 version.
No figure in this series has been revised since we began recording on 20 Oct 2026.
- 29 periods, latest Aug 2026: 4.8% · first snapshotArchived source
81a5b88af920
Release notes (2)
- 5.0%Jul 2026, final (revised from 5.4% provisional)
- 4.8%Aug 2026, provisional
Get the data
Use it in Excel, Python or R
Excel (Data → From Web): https://india.tf/c/eco-core-073/data.csv
Python: pandas.read_csv("https://india.tf/c/eco-core-073/data.csv")
R: read.csv("https://india.tf/c/eco-core-073/data.csv")
All statistics: /api/index.json. Free to reuse with attribution (GODL-India).