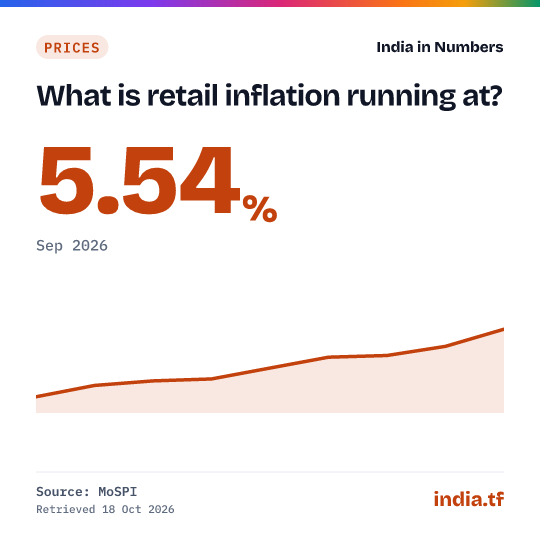
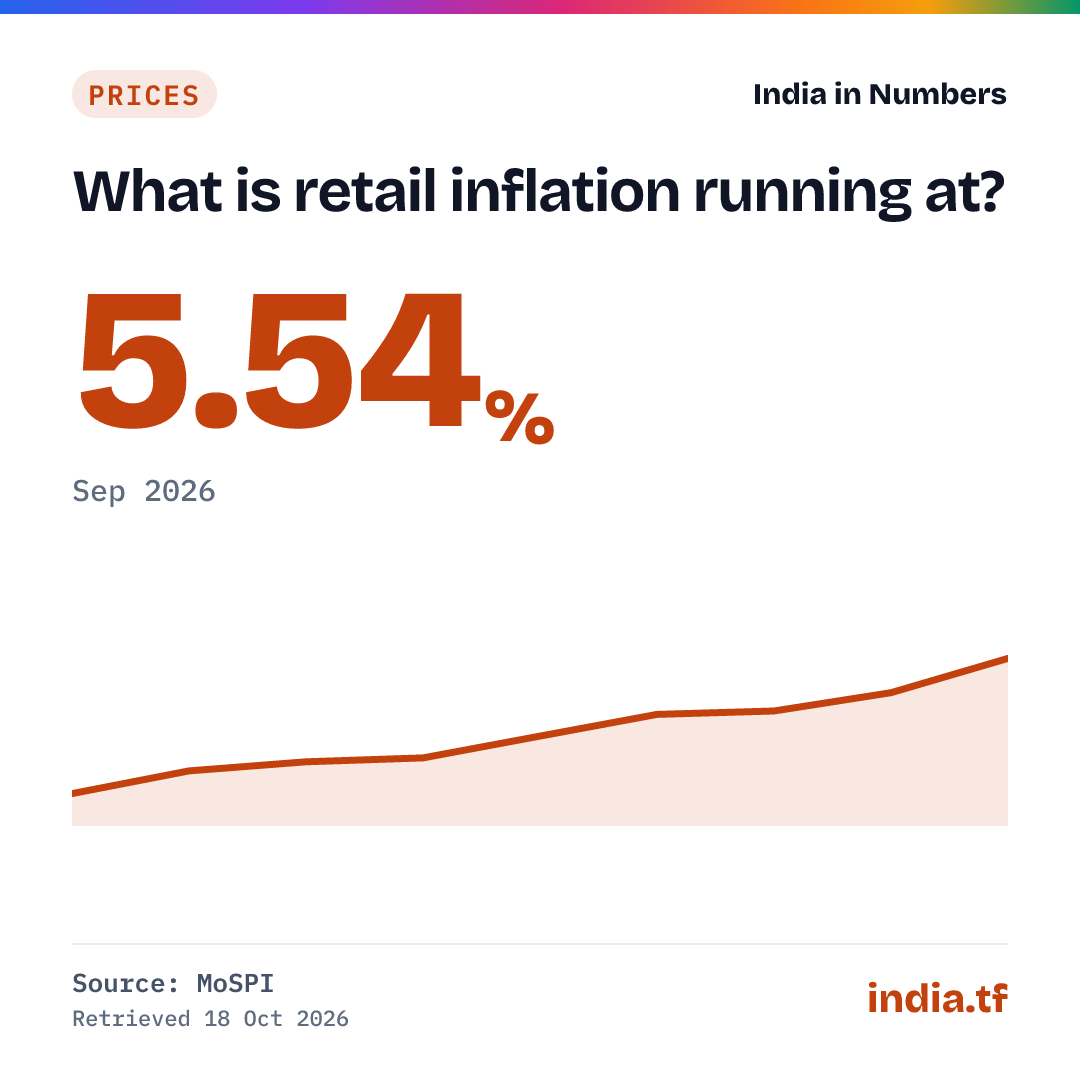
What is retail inflation running at?
MoSPI · released 12 Oct 2026 · next due by 12 Nov 2026
| Period | Value (%) |
|---|---|
| Sep 2026 | 5.54 |
| Aug 2026 | 4.83 |
| Jul 2026 | 4.45 |
| Jun 2026 | 4.38 |
| May 2026 | 3.93 |
| Apr 2026 | 3.48 |
| Mar 2026 | 3.40 |
| Feb 2026 | 3.21 |
| Jan 2026 | 2.74 |
Use in your answer
Retail inflation in India, measured by the all-India Consumer Price Index (base 2024=100), was 5.54% in Sep 2026, compared with 4.83% in Aug 2026. Source: MoSPI, Consumer Price Index (base 2024=100).
Cite as: Consumer Price Index (Rural, Urban, Combined) (NSO, MoSPI), Sep 2026
What this shows
- Retail inflation was 5.54% in September 2026 (provisional), up from 2.74% in January 2026, the first month on the new 2024 base.
- Food inflation ran higher: the Consumer Food Price Index rose 7.74% year on year in September 2026.
- Rural inflation (6.08%) was above urban (4.88%) in September 2026.
Cite this
Cite a fixed version from every published version below.
Source and method
What exactly is measured
Year-on-year change in the all-India Consumer Price Index (Combined, base 2024=100), released monthly by MoSPI. CPI was rebased to 2024 and year-on-year rates on the new base start in January 2026; rates on the old 2012 base are not comparable, so they are not shown. The latest month is provisional.
Retail inflation by state
Year-on-year CPI inflation (base 2024=100), combined rural and urban. Source: MoSPI, Consumer Price Index (base 2024=100), State/UT-wise, Sep 2026.
Where
Ranked
How are the states spread?
12 of 36 states fall between 5% and 6%. Each column counts the states in one band of retail inflation; the dashed line is the all-India figure.
Hover a column for the states in it. Bands are equal widths of the state figures, Sep 2026.
History: every published version
Each time the source changes this series we archive the full series as it stood, with an archived copy of the source, and never delete an old version. Each version has a permanent page you can cite. Recorded since 18 Oct 2026: 1 version.
No figure in this series has been revised since we began recording on 18 Oct 2026.
- 9 periods, latest Sep 2026: 5.54% · first snapshotArchived source
fbac74c1b62a
Release notes (2)
- 4.83%Aug 2026, final
- 5.54%Sep 2026, provisional
Get the data
Use it in Excel, Python or R
Excel (Data → From Web): https://india.tf/c/eco-cpi-002/data.csv
Python: pandas.read_csv("https://india.tf/c/eco-cpi-002/data.csv")
R: read.csv("https://india.tf/c/eco-cpi-002/data.csv")
All statistics: /api/index.json. Free to reuse with attribution (GODL-India).