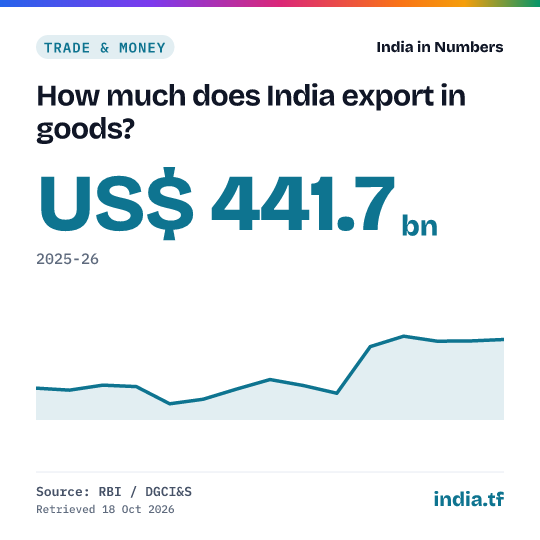
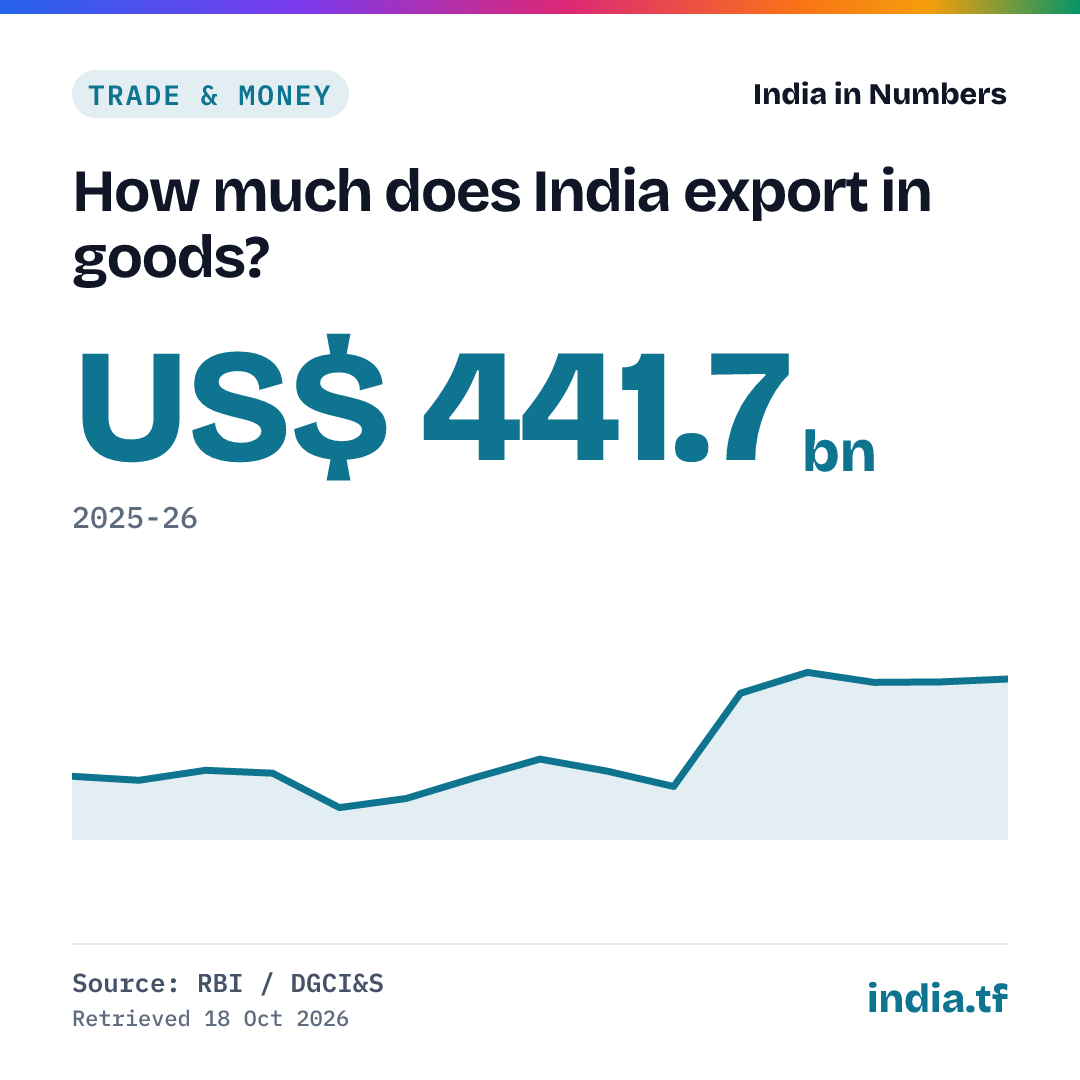
How much does India export in goods?
RBI / DGCI&S · released 31 Jul 2026
| Period | Value (US$ bn) |
|---|---|
| 2025-26 | 441.7 |
| 2024-25 | 437.7 |
| 2023-24 | 437.1 |
| 2022-23 | 451.1 |
| 2021-22 | 422.0 |
| 2020-21 | 291.8 |
| 2019-20 | 313.3 |
| 2018-19 | 330.1 |
| 2017-18 | 303.4 |
| 2016-17 | 275.1 |
| 2015-16 | 262.3 |
| 2014-15 | 310.4 |
| 2013-14 | 314.4 |
| 2012-13 | 300.4 |
| 2011-12 | 306.0 |
Use in your answer
India's merchandise exports were US$ 441.7 bn in 2025-26, compared with US$ 437.7 bn in 2024-25. Source: RBI, Handbook of Statistics on the Indian Economy 2025-26, Table 111: India's Foreign Trade - US Dollar (DGCI&S data).
Cite as: Handbook of Statistics on the Indian Economy 2025-26, Table 111: India's Foreign Trade - US Dollar (DGCI&S)
What this shows
- Merchandise exports were US$ 441.7 billion in 2025-26 (provisional), up from US$ 437.7 billion in 2024-25; the highest year in the series is 2022-23, at US$ 451.1 billion.
- Oil exports fell to US$ 53.8 billion in 2025-26 from US$ 63.4 billion, while non-oil exports rose to US$ 387.9 billion from US$ 374.3 billion.
- These are customs (DGCI&S) figures; the RBI's balance of payments, compiled on a different basis, puts 2025-26 goods exports at US$ 446.1 billion.
Cite this
Cite a fixed version from every published version below.
Source and method
What exactly is measured
The value of India's merchandise (goods) exports in each financial year, in US dollars, from the customs-based trade data of the Directorate General of Commercial Intelligence and Statistics (DGCI&S) as published by the RBI. Services exports are not included. The latest year is provisional.
History: every published version
Each time the source changes this series we archive the full series as it stood, with an archived copy of the source, and never delete an old version. Each version has a permanent page you can cite. Recorded since 18 Oct 2026: 1 version.
No figure in this series has been revised since we began recording on 18 Oct 2026.
- 15 periods, latest 2025-26: US$ 441.7 bn · first snapshotArchived source
0a959354b6d8
Release notes (1)
- US$ 441.7 bn2025-26 provisional; 2024-25 revised (Handbook of Statistics 2025-26)
Get the data
Use it in Excel, Python or R
Excel (Data → From Web): https://india.tf/c/trd-exports-040/data.csv
Python: pandas.read_csv("https://india.tf/c/trd-exports-040/data.csv")
R: read.csv("https://india.tf/c/trd-exports-040/data.csv")
All statistics: /api/index.json. Free to reuse with attribution (RBI website terms of use).