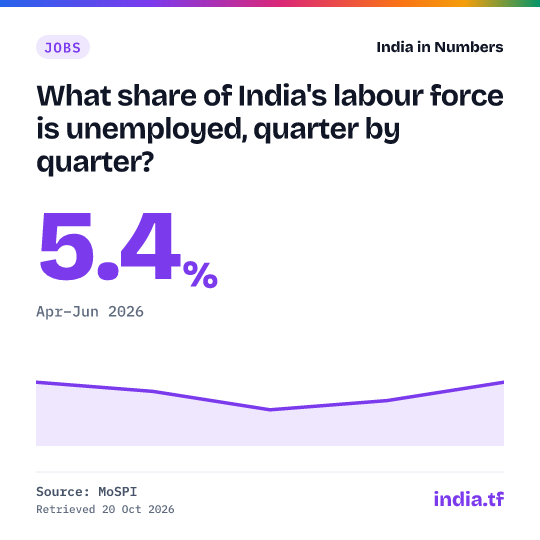
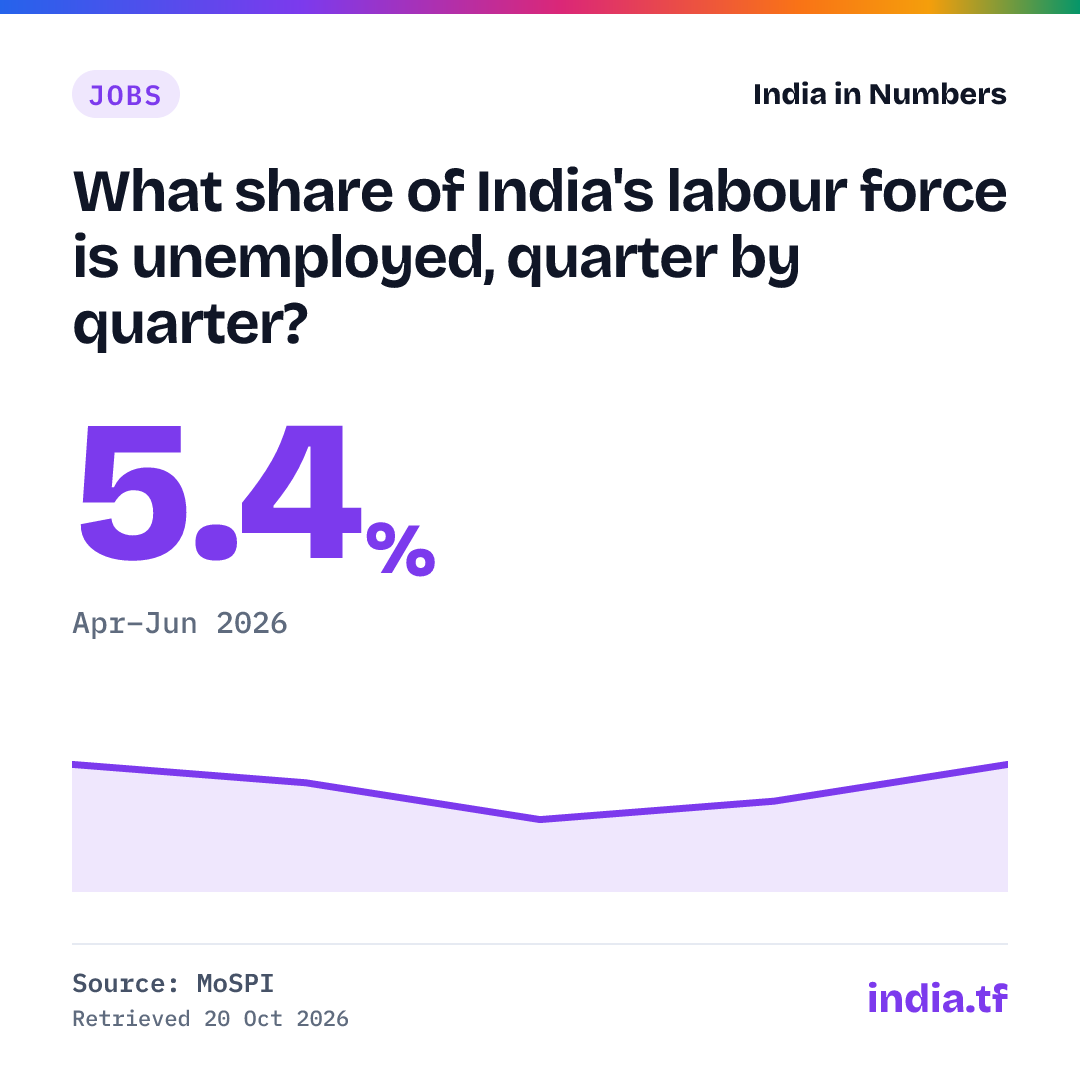
What share of India's labour force is unemployed, quarter by quarter?
MoSPI · released 10 Aug 2026 · next due by 5 Dec 2026
| Period | Value (%) |
|---|---|
| Apr–Jun 2026 | 5.4 |
| Jan–Mar 2026 | 5.0 |
| Oct–Dec 2025 | 4.8 |
| Jul–Sep 2025 | 5.2 |
| Apr–Jun 2025 | 5.4 |
Use in your answer
India's unemployment rate was 5.4% in Apr–Jun 2026 (persons aged 15 and above, current weekly status, quarterly bulletin), compared with 5.0% in Jan–Mar 2026. Source: MoSPI, Periodic Labour Force Survey, Quarterly Bulletin.
Cite as: Periodic Labour Force Survey (PLFS), Quarterly Bulletin (NSO, MoSPI), Apr–Jun 2026
What this shows
- Unemployment was 5.4% in April–June 2026 (persons 15+, current weekly status), up from 5.0% in January–March 2026 and the same as in April–June 2025.
- Towns fare worse than villages: urban unemployment was 6.7% against 4.8% in rural areas in April–June 2026; among urban women it was 8.7%.
- Across the 22 states in the bulletin, unemployment in April–June 2026 ranged from 2.9% in Karnataka to 12.8% in Chhattisgarh; Kerala (8.9%) and Punjab (8.5%) were also high.
Cite this
Cite a fixed version from every published version below.
Source and method
What exactly is measured
Unemployment rate for persons aged 15 and above, rural and urban India combined, in current weekly status (CWS), from the Periodic Labour Force Survey quarterly bulletin. PLFS changed its survey design in January 2025; only quarters on the new design, from April–June 2025, are shown, and they are not comparable with older usual-status or urban-only figures.
Unemployment by state
Unemployment rate, persons aged 15 and above, rural and urban combined, current weekly status. State estimates rest on small samples (the bulletin publishes their standard errors), so small gaps between states are not meaningful. Source: MoSPI, Periodic Labour Force Survey, Quarterly Bulletin, Apr–Jun 2026.
How are the states spread?
9 of 22 states fall between 4% and 6%. Each column counts the states in one band of unemployment; the dashed line is the all-India figure.
Hover a column for the states in it. Bands are equal widths of the state figures, Apr–Jun 2026.
History: every published version
Each time the source changes this series we archive the full series as it stood, with an archived copy of the source, and never delete an old version. Each version has a permanent page you can cite. Recorded since 20 Oct 2026: 1 version.
No figure in this series has been revised since we began recording on 20 Oct 2026.
- 5 periods, latest Apr–Jun 2026: 5.4% · first snapshotArchived source
0d62201a7374
Release notes (1)
- 5.4%Apr–Jun 2026, quarterly bulletin
Get the data
Use it in Excel, Python or R
Excel (Data → From Web): https://india.tf/c/job-urq-092/data.csv
Python: pandas.read_csv("https://india.tf/c/job-urq-092/data.csv")
R: read.csv("https://india.tf/c/job-urq-092/data.csv")
All statistics: /api/index.json. Free to reuse with attribution (GODL-India).